Sound and Vibration Instrument Hire and Calibration
Bruel & Kjaer 2250 + BZ 7223 Frequency Analysis Software
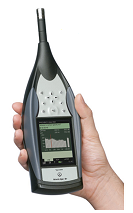
The B&K 2250 multi-function meter is designed for all sound and vibration measurements, analysis and recording applications. This page describes the included BZ 7223 Frequency Analysis Software
For information on other features, options and accessories click any relevant blue link

B&K 2250 : Specifications
Software included
BZ 5503 : PC Utility Software
BZ 7222 : Sound Analysis
BZ 7223 : Frequency Analysis
BZ 7224 : Logging
BZ 7225 : Enhanced Logging : new 2017
BZ 7226 : Sound/Vibration Recording
Other options available
BZ 7227 : Reverberation Time
BZ 7228 : Sound Insulation
BZ 7230 : FFT Measurement
BZ 7231 : Tone Assessment
B&K 2250 Detailed Image
| Bruel & Kjaer 2250 + BZ 7223 Frequency Analysis Software | included |
|---|

The Frequency Analysis module included in all our 2250 Sound Level Meters, providing real-time analysis of the 1/1- and 1/3-octave filter bands over a wide frequency range, and over a dynamic range from the noise floor in each individual band to a maximum level of 140 dB.
Spectral data can be measured for five different parameters (Leq, LFmax, LFmin, LSmax, LSmin). You can select which frequency weight (A,C or Z) during the measurement setup. In addition, instantaneous values are available for display. Two spectra, for example, a minimum and maximum spectrum, can be superimposed on the display.
UsesOne measurement is all you need
A single, wide dynamic range, combined with simultaneous measurement of RMS and peak levels with different frequency and time weightings, you can gather all information in one go.
Large display for more accurate measurements
Observe measurements from a distance, avoiding acoustic reflections from your body which would bias the measurement.
Everything in one glance without clutter
The colour display provides spectral data both graphically and in tabular form, clearly providing a wealth of data and measurement quality information in an easy-to-navigate way.
B&K 2250 Frequency Analysis Specifications.
* Our standard hire charges are based on a 4-day minimum period, details other options.